
 by
by Metrics Data Block Now Added
Five years ago we added the functionality to display your data on DAKboard via fetch, but now you can instead push these metrics to DAKboard! With the new “Metrics Data” block, DAKboard Plus and Pro subscribers no longer need to host your own metrics for DAKboard to fetch and display, ending the need to maintain that internet accessible endpoint for fetch.


You need to post metrics to us first in order to find them, so our API documentation has been modified with how to do that. All the details can be seen here.
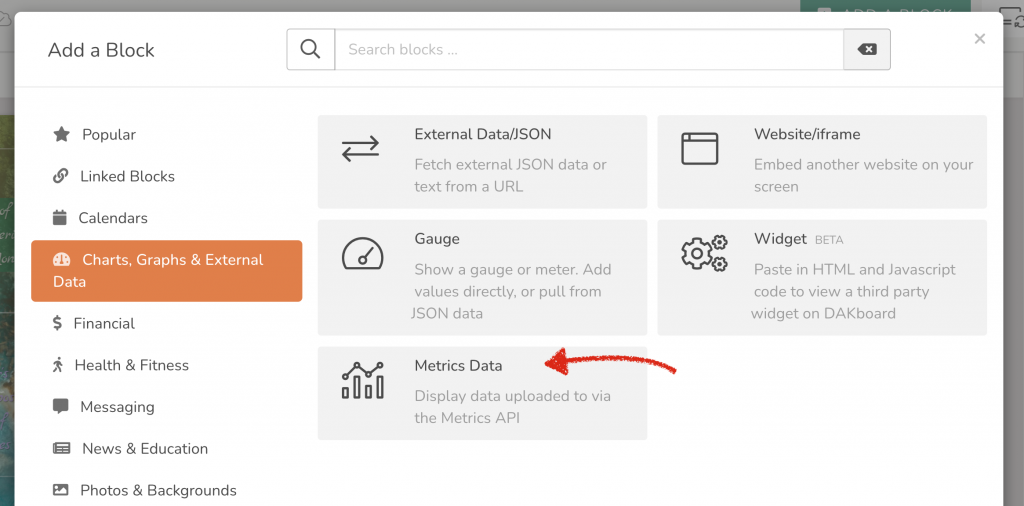
Once you are posting metrics to us, find the Metrics Data block in the Charts, Graphs & External Data section or type the block title in the search bar.
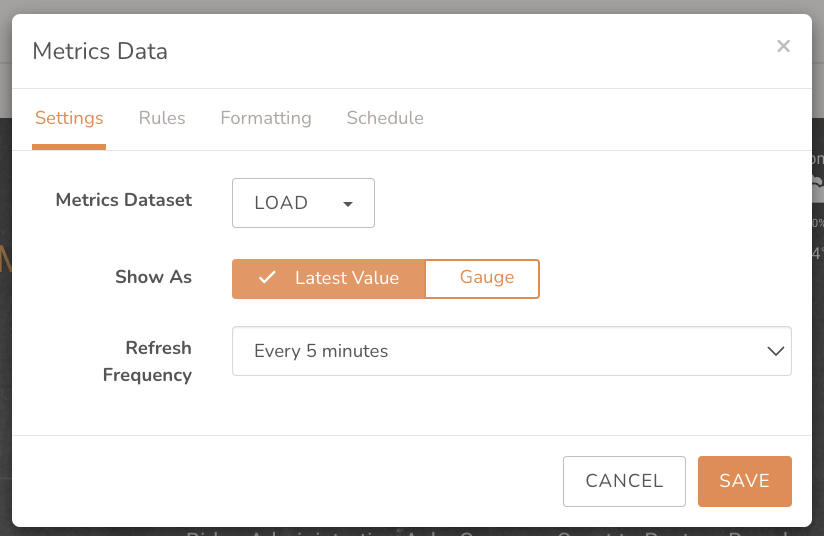
Your metric name for your data will display in the Metrics Dataset. You can display the value, the text or in Gauge, it can be displayed as a number.
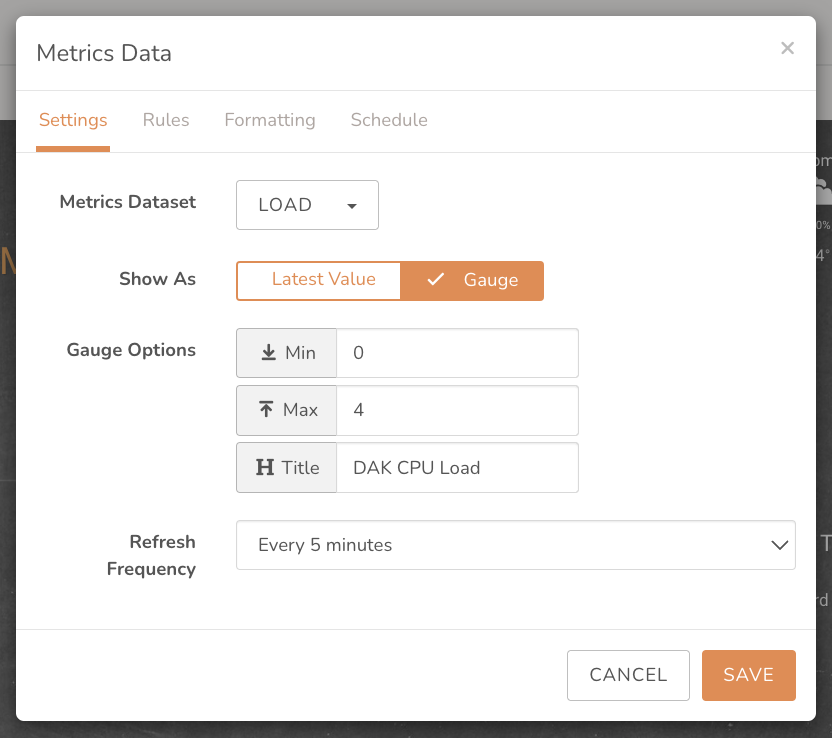
Same as with fetch, you will find that DAKboard supports custom rules and additional formatting of data such as rounding and truncating.
You can send DAKboard up to 1,000 records per metric. The oldest records will be deleted if the limit is exceeded.
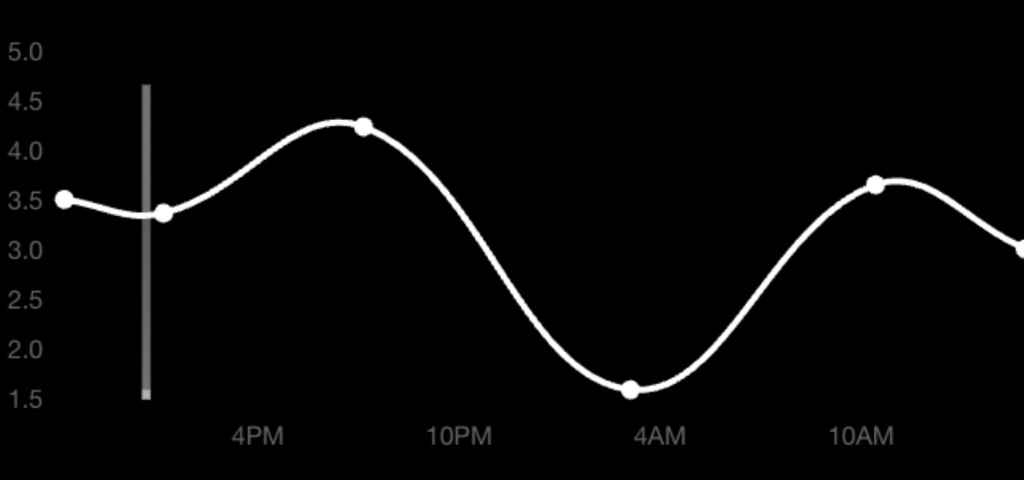
Coming Soon
We’re currently working to add a line chart that you will be able to use with your data to help better visualize trends.
DAKboard App Reissued on Android
The DAKboard app has now been released for Android 8.0 and above for users with Android devices. It is running the same way as it had been before. A reminder that you cannot use Google Authentication for login, however this is a future goal for the app. Find more information in our solutions article.
Thanks!
We hope you find this functionality in DAKboard useful. As always, feel free to comment below, or contact us through our support site with any questions or feedback.